Pythonで状態に合わせてボタンの見た目を変える(Tkinter)
PythonにもGUIフレームワークがあるということで基本的なところを勉強した。こだわり始めるとキリがなく、Pythonの習得から外れていくので気を付けたい。
結果
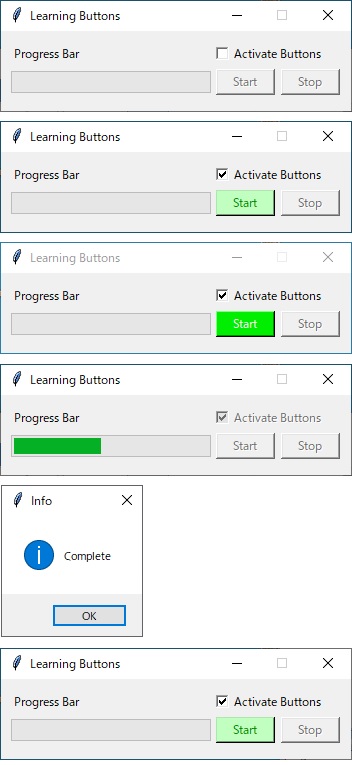
チェックボックスでスタートボタンのアクティブ ⇔ グレーアウトをコントロール。処理中はスタートボタンをグレーアウト。実際には処理はWhileでカウントアップしているだけ。ただ、その進捗をプログレスバーで表している。
※ストップボタンは表示しているだけ。スレッドの勉強をしてからストップ機能を実装する予定。
1段目:チェックボックスがFalseでボタンはグレーアウト。
2段目:チェックボックスがTrueでボタンがアクティブ。アクティブのときの背景色と文字色を表示。
3段目:ボタンにカーソルを重ねたとき、背景色と文字色を変更。
4段目:処理中。チェックボックスとボタンはグレーアウト。
5段目:プログレスが100%になったら、メッセージボックスを表示する。
6段目:メッセージボックスを閉じると、プログレスがクリアされる。

プログラム
# 22_tkinter_button_001.py
# python 3.8.1
# tkinter 8.6
# coding: utf-8
#
import tkinter as tk
from tkinter import ttk as ttk
from tkinter import messagebox as tkm
from tkinter import HORIZONTAL
from time import sleep

#プログレスバーの進捗度を保存する変数
prbval = 0

#サイズ350x80で固定のウィンドウ作成
root = tk.Tk()
root.title("Learning Buttons")
root.geometry('350x80')
root.resizable(width=False, height=False)

#スタートボタンの内容
def button_click():
    global prbval
    b1.configure(state=tk.DISABLED, bg='SystemButtonFace')
    chk1.configure(state=tk.DISABLED)

    try:
#       raise ZeroDivisionError
        while prbval <= 20:
            sleep(0.1)
            prbval = prbval + 1
            prb.configure(value = prbval)
            prb.update()                    #この1行がないとプログレスが描画されない
        tkm.showinfo("Info", "Complete")
    except:
        tkm.showerror("Error", "Unexpected error!!")
        pass

    prbval = 0
    prb.configure(value = prbval)
    b1.configure(state=tk.NORMAL, fg='Green4', bg='DarkSeaGreen1')
    chk1.configure(state=tk.NORMAL)

#スタートボタンにカーソルを重ねたときの挙動
def mouseOver(event):
    if b1['state'] == 'normal':
        b1.configure(fg='Snow', bg='Green2')
    else:
        return

#スタートボタンからカーソルを外したときの挙動
def mouseOut(event):
    if b1['state'] == 'normal':
        b1.configure(fg='Green4', bg='DarkSeaGreen1')
    else:
        return

#チェックボックスの内容
def switch(bln):
    if bln == True:
        b1.configure(state=tk.NORMAL, fg='Green4', bg='DarkSeaGreen1')
    else:
        b1.configure(state=tk.DISABLED, bg='SystemButtonFace')

#チェックボックスの状態を表す変数の定義
bln1 = tk.BooleanVar()
bln1.set(False)

#チェックボックス作成
chk1 = tk.Checkbutton(root, variable=bln1, text="Activate Buttons", command=lambda: switch(bln1.get()))
chk1.place(x=210, y=10)

#プログレスバー用のラベル作成
lb1 = tk.Label(text="Progress Bar")
lb1.place(x=10, y=12)

#プログレスバー作成
prb = ttk.Progressbar(root, orient=HORIZONTAL, length=200, mode='determinate')
prb.configure(maximum=20, value=prbval)
prb.place(x=10, y=40)

#スタートボタン作成、デフォルトがDISABLED
b1 = tk.Button(
    root,
    text = "Start",
    width = 7,
    state = tk.DISABLED,
    disabledforeground = 'Gray45',
    command = button_click
    )
b1.bind('<Enter>', mouseOver)
b1.bind('<Leave>', mouseOut)
b1.place(x=215, y=38)

#ストップボタン作成
b2 = tk.Button(
    root,
    text = "Stop",
    width = 7,
    state = tk.DISABLED
    )
b2.place(x=280, y=38)

root.mainloop()
参考サイト
tkinterのさわり
Tkinter 使ってみよう - Python 入門
Tkinterを使ってファイル選択GUIを構築しよう | DS Hack
tkinter カラーチャート
File:TkInterColorCharts.png - dftwiki
Bottonのオプション一覧
【Tkinter】ボタン(Button)の使い方
BottonのBindとイベントシーケンス
Tkinter の bind とイベントシーケンス
ButtonのEnable/Disable
python - Disable / Enable Button in TKinter - Stack Overflow
【tkinter】ウィジェットを無効化する方法【Python】 - 初心者でもPythonを使ってみよう
CheckBoxのイベント連携
Python チェックボタンを動的に作成しボタンイベントと連携する(Checkbutton) | 鎖プログラム
Progressbarについて
【Python GUIサンプル】TkinterでProgressbar(プログレスバー)を使ってみる | エンジニアになりたいブログ
python - Setting `orient` keyword argument for Tkinter Scale widget results in NameError: name 'HORIZONTAL' is not defined - Stack Overflow
tkinter.ttk Progressbarの使い方 Python - 初心者でもPythonを使ってみよう
Pythonとopencv4で特徴量パターンマッチング(AKAZE)
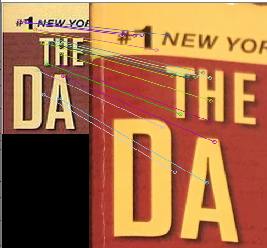
いよいよパターンマッチングに着手。
まさにやりたいことを紹介してくれているサイトはあるが、やはりそのままでは動かない。OpenCV2 → 3 → 4 になるにつれて抜けてる機能があるのが原因かと。
cv2.drawMatchesKnn()は使えないので注意!
準備
Pyhton-contribをインストールする。pipで以下のコマンドを実行。
pip install opencv-contrib-python
プログラム
# 21_BFMatcher_001.py
# python 3.8.1
# opencv-contrib-python 4.2.0.32
# opencv-python         4.1.2.30
# coding: utf-8
#
import cv2
import numpy as np

#参照画像(img_ref)と比較画像(img_comp)の読み込み
img_comp = cv2.imread("21_comp.jpg")
img_ref  = cv2.imread("21_ref.jpg")

#グレースケース変換
gray_img_comp = cv2.cvtColor(img_comp, cv2.COLOR_BGR2GRAY)
gray_img_ref  = cv2.cvtColor(img_ref, cv2.COLOR_BGR2GRAY)

#AKAZEの中で輪郭をぼかすフィルターが入っているので、前処理はしない
#gray_img_comp = cv2.blur(img_comp, (3, 3))
#gray_img_ref  = cv2.blur(img_ref, (3, 3))

#AKAZE検出器の生成
akaze = cv2.AKAZE_create()

#特徴量の計算
kp1, des1 = akaze.detectAndCompute(gray_img_comp, None)
kp2, des2 = akaze.detectAndCompute(gray_img_ref, None)

#Brute-Force Matcher生成
bf = cv2.BFMatcher(cv2.NORM_HAMMING, crossCheck=False)
#bf = cv2.BFMatcher(cv2.NORM_L1, crossCheck=False)
#bf = cv2.BFMatcher(cv2.NORM_L2, crossCheck=False)

#特徴量ベクトル同士をBrute-Force&knnでマッチング
matches = bf.knnMatch(des1, des2, k=2)
#matches = sorted(matches, key = lambda x:x.distance)

# データを間引きする
ratio = 0.5
good = []
for m, n in matches:
    if m.distance < ratio * n.distance:
        good.append(m)

#対応する特徴点同士を描画
img_result = cv2.drawMatches(img_comp, kp1, img_ref, kp2, good, None, flags=2)

#画像表示
cv2.namedWindow("Result", cv2.WINDOW_NORMAL)
cv2.imshow('Result', img_result)
cv2.waitKey(0)
cv2.destroyAllWindows()
Pythonで2枚の画像の(単純な)差分をバウンディングボックスで囲う
2つの画像を比較して、差異を部分を枠で囲うプログラム。まずは単純に2つの画像の引き算を行うだけの簡単な処理から。
画像はおなじみのLean。比較画像は、参照画像にペイントでお絵描きしたもの。なので、横ずれや回転が生じていない想定。
結果
2か所誤検出があったが、ほぼ狙い通り検出できた。
上段左:参照画像(元の画像) 右:比較画像(元の画像にお絵描きしたもの)
中段左:差分画像 右:差分画像の2値化
下段:参照画像にバウンディングボックスを描画したもの

プログラム
# 20_SimpleImageComp_001.py
# python 3.8.1
# opencv-python 4.1.2.30
# coding: utf-8
#
import cv2
import numpy as np
from matplotlib import pylab as plt

#参照画像(img_ref)と比較画像(img_comp)の読み込み
img_ref  = cv2.imread('20_ref.jpg', 1)
img_comp = cv2.imread('20_comp.jpg', 1)
temp = img_comp.copy()

#グレースケース変換
gray_img_ref  = cv2.cvtColor(img_ref, cv2.COLOR_BGR2GRAY)
gray_img_comp = cv2.cvtColor(img_comp, cv2.COLOR_BGR2GRAY)

#参照画像の平滑化 ※変化をつけるためにわざと加えている
gray_img_ref  = cv2.blur(gray_img_ref, (3, 3))

#単純に画像の引き算
img_diff = cv2.absdiff(gray_img_ref, gray_img_comp)

#差分画像の2値化(閾値が50)
ret, img_bin = cv2.threshold(img_diff, 50, 255, 0)

#2値画像に存在する輪郭の座標値を得る
contours, hierarchy = cv2.findContours(img_bin, cv2.RETR_TREE, cv2.CHAIN_APPROX_SIMPLE)

#contoursから一個ずつ輪郭を取り出し、輪郭の位置(x,y)とサイズ(width, height)を得る
#サイズが 5x5 以上の輪郭を枠で囲う。
for contour in contours:
    x, y, width, height = cv2.boundingRect(contour)
    if width > 5 or height > 5:
        cv2.rectangle(temp, (x-2, y-2), (x+width+2, y+height+2), (0, 255, 0), 1)
    else:
        continue

#画像表示
cv2.imshow("Original images", np.hstack([img_ref, img_comp]))
cv2.imshow("Processed images", np.hstack([img_diff, img_bin]))
cv2.imshow("Result", temp)
cv2.waitKey(0)
cv2.destroyAllWindows()
Pyhtonで円検出
円形の検出処理の勉強
結果
OpenCVのハフ変換で円検出した。
左が元画像、左が検出結果をオーバレイした画像

プログラム
# 19_CircleDetection_001.py
# python 3.8.1
# coding: utf-8
#
import cv2
import numpy as np
from matplotlib import pylab as plt

img = cv2.imread('19_test2.jpg')
output = img.copy()

#Prep the detection circles
gray = cv2.cvtColor(img, cv2.COLOR_BGR2GRAY)
gray = cv2.medianBlur(gray ,5)

#Detect circles
circles = cv2.HoughCircles(gray, cv2.HOUGH_GRADIENT, 1, 10, param1=100, param2=20, minRadius=5, maxRadius=40)
circles = np.uint16(np.around(circles))

n = 0
for i in circles[0,:]:
    n+=1
    str_n = str(n)

    #Draw the outer circle
    cv2.circle(output,(i[0],i[1]),i[2],(0,255,0),2)

    #Draw the center of the circle
    #cv2.circle(cimg,(i[0],i[1]),1,(0,0,255),2)

    #Number the circles
    cv2.putText(output, str_n, (i[0], i[1]), cv2.FONT_HERSHEY_SIMPLEX, 0.7, (0, 0, 255), thickness=2)

    #Show each radius
    #print(("[%d] : %s")%(n, i[2]))

cv2.imshow("output", np.hstack([img, output]))
cv2.waitKey(0)
cv2.destroyAllWindows()
Pythonで同心円のグラデーション画像を作る
数年前に先輩から同心円の画像を作るツールがないか聞かれたことがあった。当時は心当たりがなかったのでその先輩の力になれなかった。今になって思いだしたため、Pythonで挑戦してみた。
以前つくった『Sin波のグラデーション画像を作る』プログラムをベースにした。
greenhornprofessional.hatenablog.com
結果
画像輝度値をコサイン状に可変させた同心円の画像ができた。

ラインプロファイル(画像上の黒線の断面)を見ても、それっぽくできている。

プログラム
# 18_ConcentricCircles_001.py
# python 3.8.1
# coding: utf-8
#
import numpy as np
import cv2

pix = 512       #画像のサイズ
f = 20          #周期

img = np.zeros((pix,pix,1),np.uint8)    #空の2次元リストを定義。グレースケール。

#画像のサイズを0を中心に均等に割り振る。
pix_plus  = int(pix/2 + 1)
pix_minus = int(-pix/2 + 1)

#画像座標(左上が0, 右+, 下+)に振りなおすためのオフセット値
offset = int(pix/2 -1)

#The fisrt quadrant
for y in range(0, pix_plus):
    for x in range(0, pix_plus):
        z = 100 * np.cos(np.sqrt(x**2 + y**2) / f) + 120
        img[x+offset][y+offset] = z

#The second quadrant
for y in range(0, pix_plus):
    for x in range(pix_minus, 0):
        z = 100 * np.cos(np.sqrt(x**2 + y**2) / f) + 120
        img[x+offset][y+offset] = z

#The third quadrant
for y in range(pix_minus, 0):
    for x in range(pix_minus, 0):
        z = 100 * np.cos(np.sqrt(x**2 + y**2) / f) + 120
        img[x+offset][y+offset] = z

#The fourth quadrant
for y in range(pix_minus, 0):
    for x in range(0, pix_plus):
        z = 100 * np.cos(np.sqrt(x**2 + y**2) / f) + 120
        img[x+offset][y+offset] = z

#imgを画像として保存
cv2.imwrite('Circle_512_512.jpg', img)
Pythonでcsv読み込み&書き込み(クラスに分割ver)
Pythonのクラスの書き方に手を出す。オブジェクト指向は Java を挫折してから苦手意識があるが…
とりあえず、以前つくった『Pythonでcsv読み込み&書き込み』をクラスを使って書きなおしてみた。
greenhornprofessional.hatenablog.com
プログラム
メインのpyファイル
# 17_ReadWriteCsv_001.py
# python 3.8.1
# coding: utf-8
#
import csv
import datetime
import _17_procClass_001 as pc

def main():
    now = datetime.datetime.now()

    fi = '17_peak.csv'
    fo = '17_peakResult_{0:%Y%m%d%H%M%S}.csv'.format(now)

    with open(fi, mode='r', newline='') as f_in:
        reader = csv.reader(f_in)
        data_array = [row for row in reader]

    arry_x = []
    arry_y = []

    for i in data_array:
        arry_x.append(float(i[0]))
        arry_y.append(float(i[1]))

    instance = pc.ProcClass(arry_x, arry_y)
    print("----Start-----")

    result = instance.splineInterpolation()
    print("----End-------")

    with open(fo, mode='a') as f_out:
        csvWriter = csv.writer(f_out, lineterminator = '\n')
        csvWriter.writerows(result)

if __name__ == '__main__':
    main()
クラスのpyファイル ※メインのpyファイルと同じ階層に置いている
# _17_procClass_001.py
# python 3.8.1
# coding: utf-8
#
import numpy as np
from scipy import signal, interpolate
from matplotlib import pylab as plt

class ProcClass:
    arry_x, arry_y = [], []

    def __init__(self, x, y):
        print("--Initialized--")
        self.arry_x = x
        self.arry_y = y

    def splineInterpolation(self):
        x_min = min(self.arry_x)
        x_max = max(self.arry_x)

        t = np.linspace(x_min, x_max, 100)

        f = interpolate.interp1d(self.arry_x, self.arry_y, kind="quadratic")
        y = f(t)

        splineArry = np.array([t, y])
        splineArry_t = splineArry.T

        print("Please close the figure1 to continue.")

        plt.plot(self.arry_x, self.arry_y,"r")
        plt.plot(t, y)
        plt.show()

        return splineArry_t
Pythonでデータロガーのような動的グラフを表示する
実験で使うデータロガーや、株価の推移など、データを動的なグラフにしてモニタリングしたいシーンはたくさんあると思う。使いどころが多いともうので勉強してみた。
結果
RC回路の過渡現象をシミュレーションしてみた。
参考:https://www.kairo-nyumon.com/rc_circuit.html
⇒時間経過とともにX軸(時間軸)、Y軸(電圧)ともに動的に表示できている。

プログラム
#16_animationPlot_001.py
# python 3.8.1
# coding: utf-8

from matplotlib import pyplot as plt
from matplotlib import animation
from matplotlib.animation import PillowWriter
import math

fig = plt.figure()

xlim = [0,50]           #グラフ横軸の範囲を決める
X, Y = [], []           #空リスト。XYデータを格納していく。

#RC回路パラメーター
Cap = 0.5 / 1000000     #静電容量 uF
Res = 33 * 1000         #抵抗 kΩ
Tau = -1 * (1/Cap/Res)  #時定数
Va  = 5                 #振幅 V

def transient(t):
    t = t / 1000        #時間 msec
    v = Va * (1-(math.exp(Tau * t)))        #電圧推移の計算
    return(v)

def plot(i):                                #引数iは使わないけど、消すとエラーになる。
    plt.cla()                               #前のグラフを削除
    Y.append(transient(len(Y)))             #Yの大きさ=データの数=時間
    X.append(len(Y))

    if len(X) > 50:                         #データが50を超えたら、表示範囲を1-51 -> 2-52 -> とずらしていく
        xlim[0]+=1
        xlim[1]+=1

    plt.plot(X, Y)                          #次のグラフを作成
    plt.title("Transient in RC-circuit")
    plt.xlim(xlim[0],xlim[1])               #X軸の表示範囲を更新する
    plt.xlabel("msec")
    plt.ylabel("V")
    plt.grid(which = "major", axis = "y", color = "gray",
             alpha = 0.8, linestyle = "--", linewidth = 0.5)
    plt.grid(which = "major", axis = "x", color = "gray",
             alpha = 0.8, linestyle = "--", linewidth = 0.5)

#100msec(これは現実の時間で、RC過渡シミュレーションの時間ではない)ごとにplot関数を呼び出す。
ani = animation.FuncAnimation(fig, plot, interval=100)

#グラフ表示をGIFで保存する。よく分かってないが4MBこえると勝手に保存が終了する、挙動を示す。
#ani.save('sample3.gif', writer='pillow')

plt.show()
参考サイト
Samurai Blogさんにドンピシャのコードがあったので参考にさせていただいた。丸コピでは動かない(Blilt = True が不要)ので注意。
matplotlib.animationで動くグラフに挑戦! | 侍エンジニア塾ブログ(Samurai Blog) - プログラミング入門者向けサイト
Matplotlib.animationの解説
Python: matplotlib で動的にグラフを生成する - CUBE SUGAR CONTAINER
matplotlib.animation — Matplotlib 3.2.0 documentation
グラフ表示について
[Matplotlib] 目盛と目盛ラベル、目盛線


